Profitability Center: Unifying the Industry-Leading Mortgage Platform Into One Actionable View
The CEO's first priority and a projected $3M+ annual business impact. I led design and partnered with product and leadership to turn a fragmented ecosystem into one intelligent interface.
At a Glance
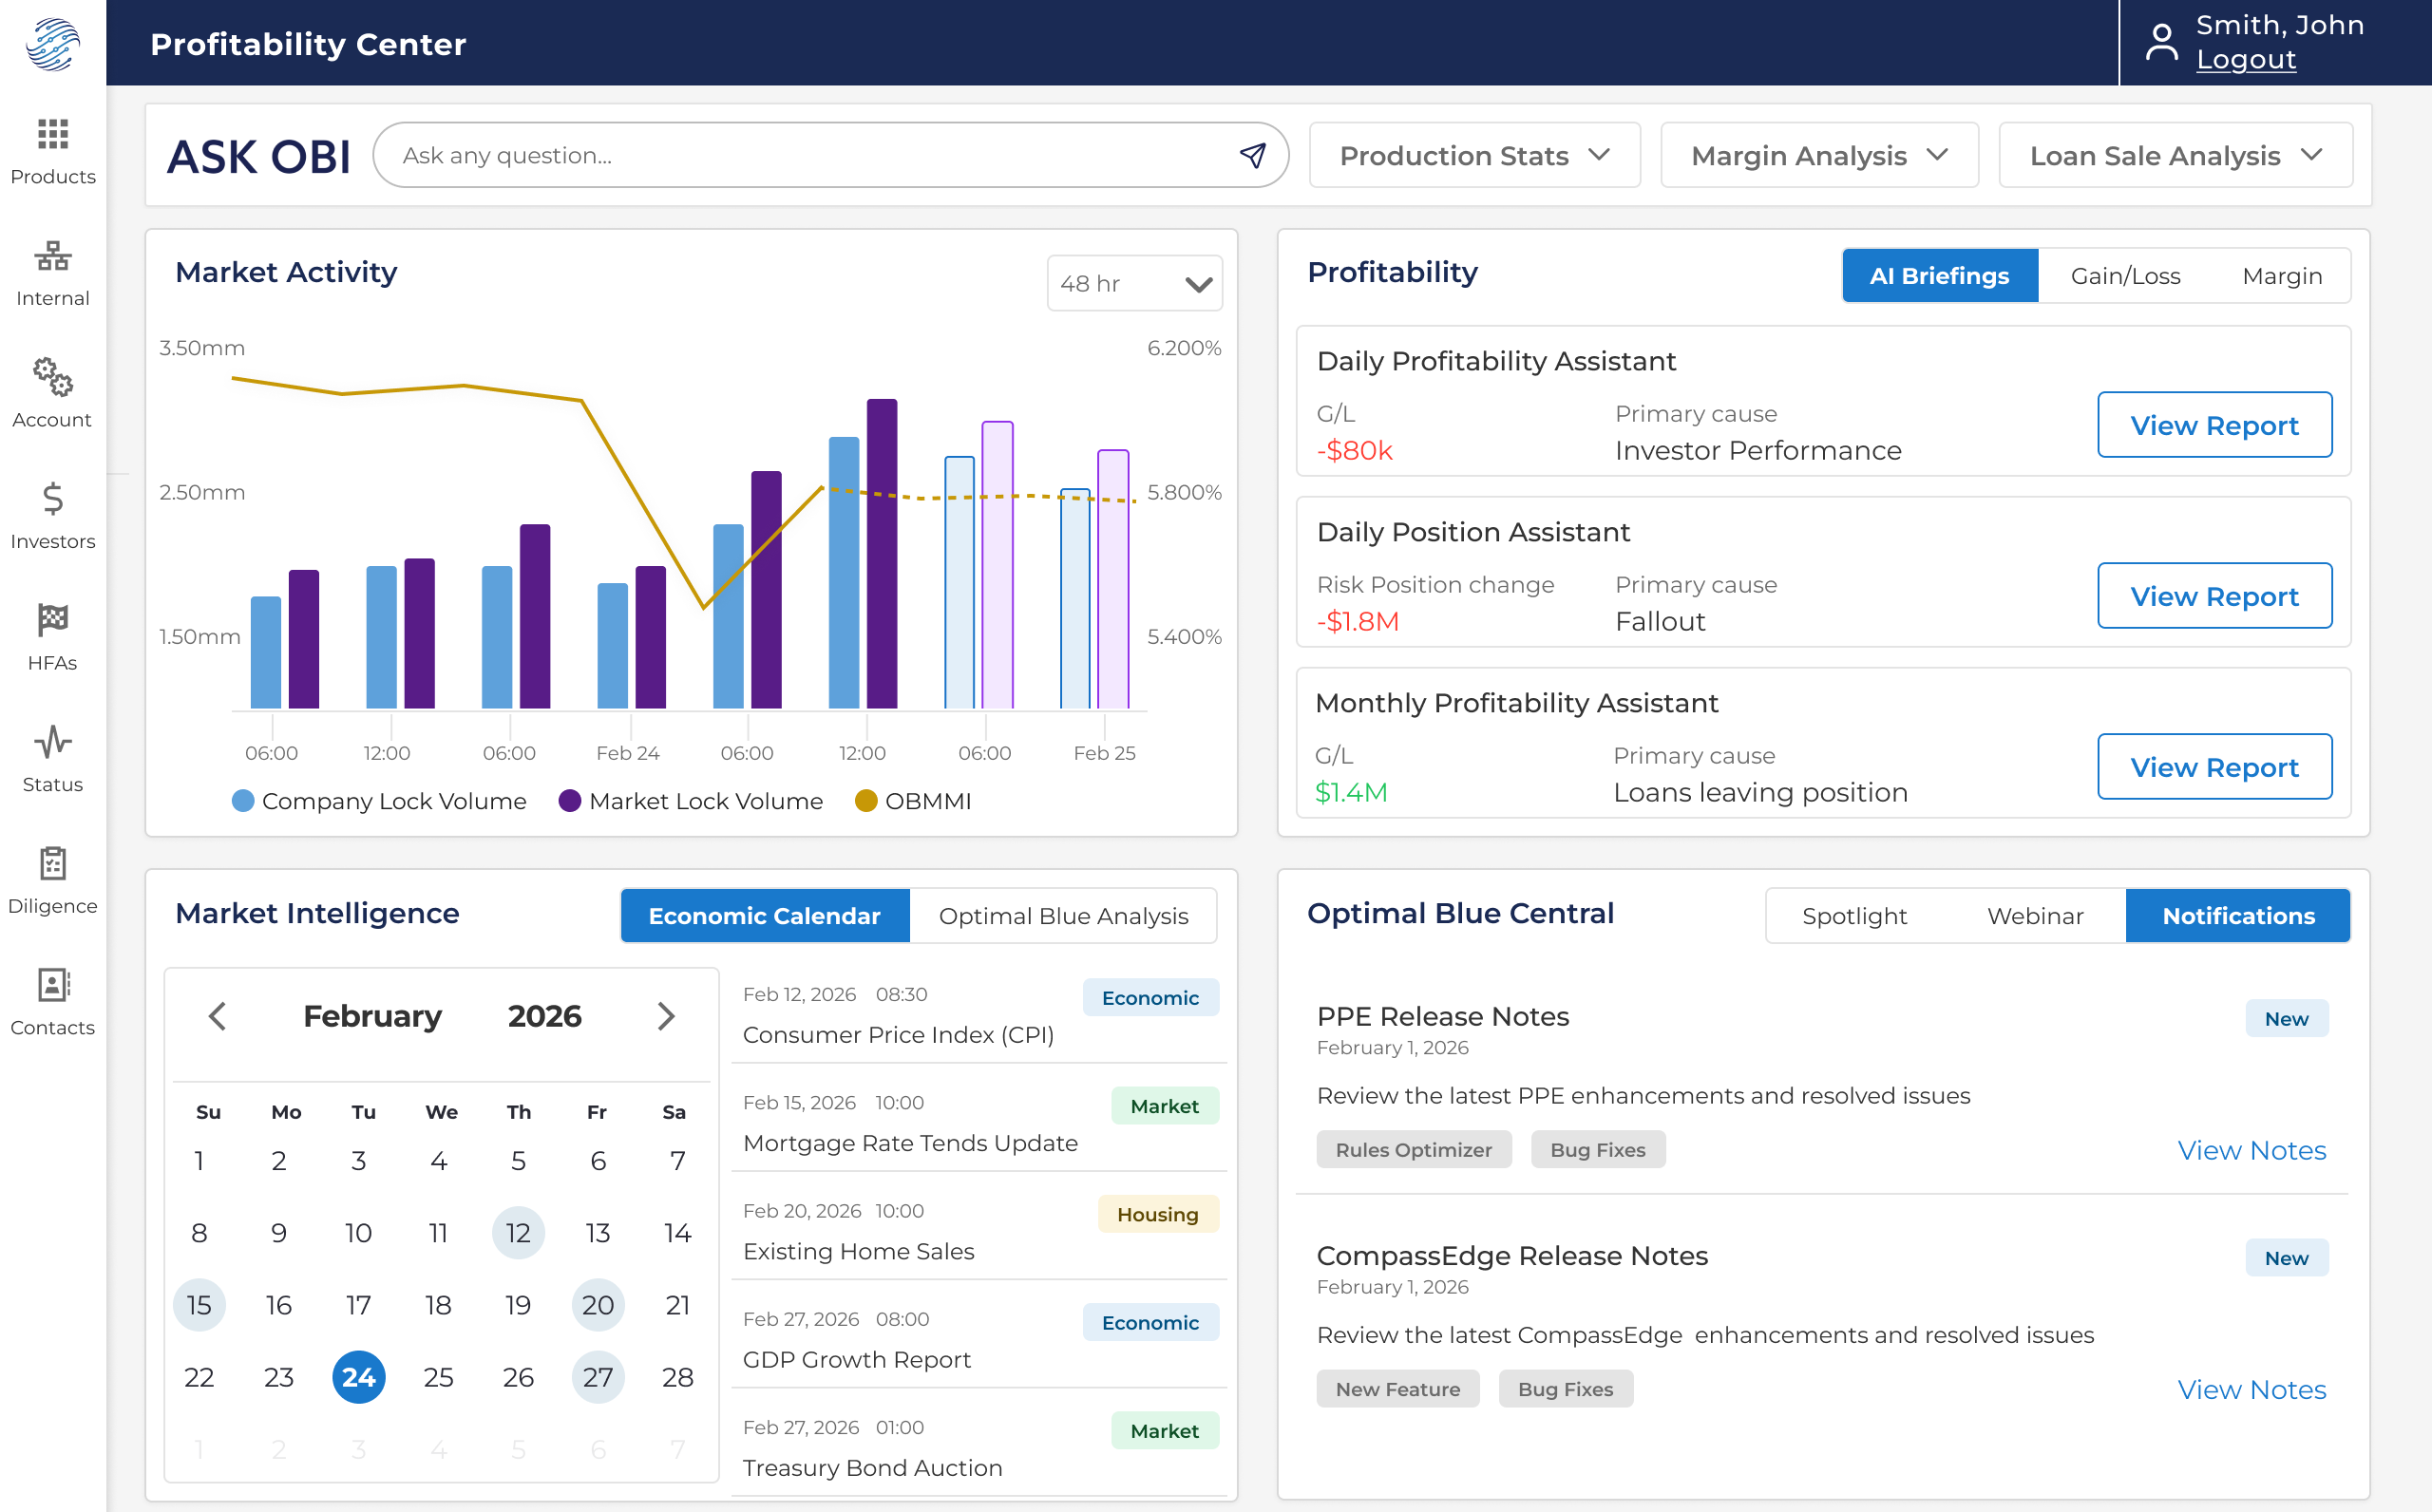
One Platform, One View
The Profitability Center brings together data that was previously scattered across the Optimal Blue ecosystem, pricing, hedging, forecasting, benchmarking, into a single view for the first time.
The business case is straightforward. Optimal Blue is the industry leader, but newer competitors have been chipping away at the edges. This dashboard attacks churn on multiple fronts: it creates brand value by consolidating disparate systems into a single view, it modernizes the first thing customers see every day when they log in, and it champions the “One Optimal Blue” vision that goes hand-in-hand with an organization-wide push toward a unified design system.
Our CPO presented it at the Optimal Blue 2026 Summit. HousingWire covered the launch.
Why This Existed
Optimal Blue had been sold from one public company to another. New CEO. New senior leadership. A company entering a new era.
The CEO’s first priority when he joined: fix this page.
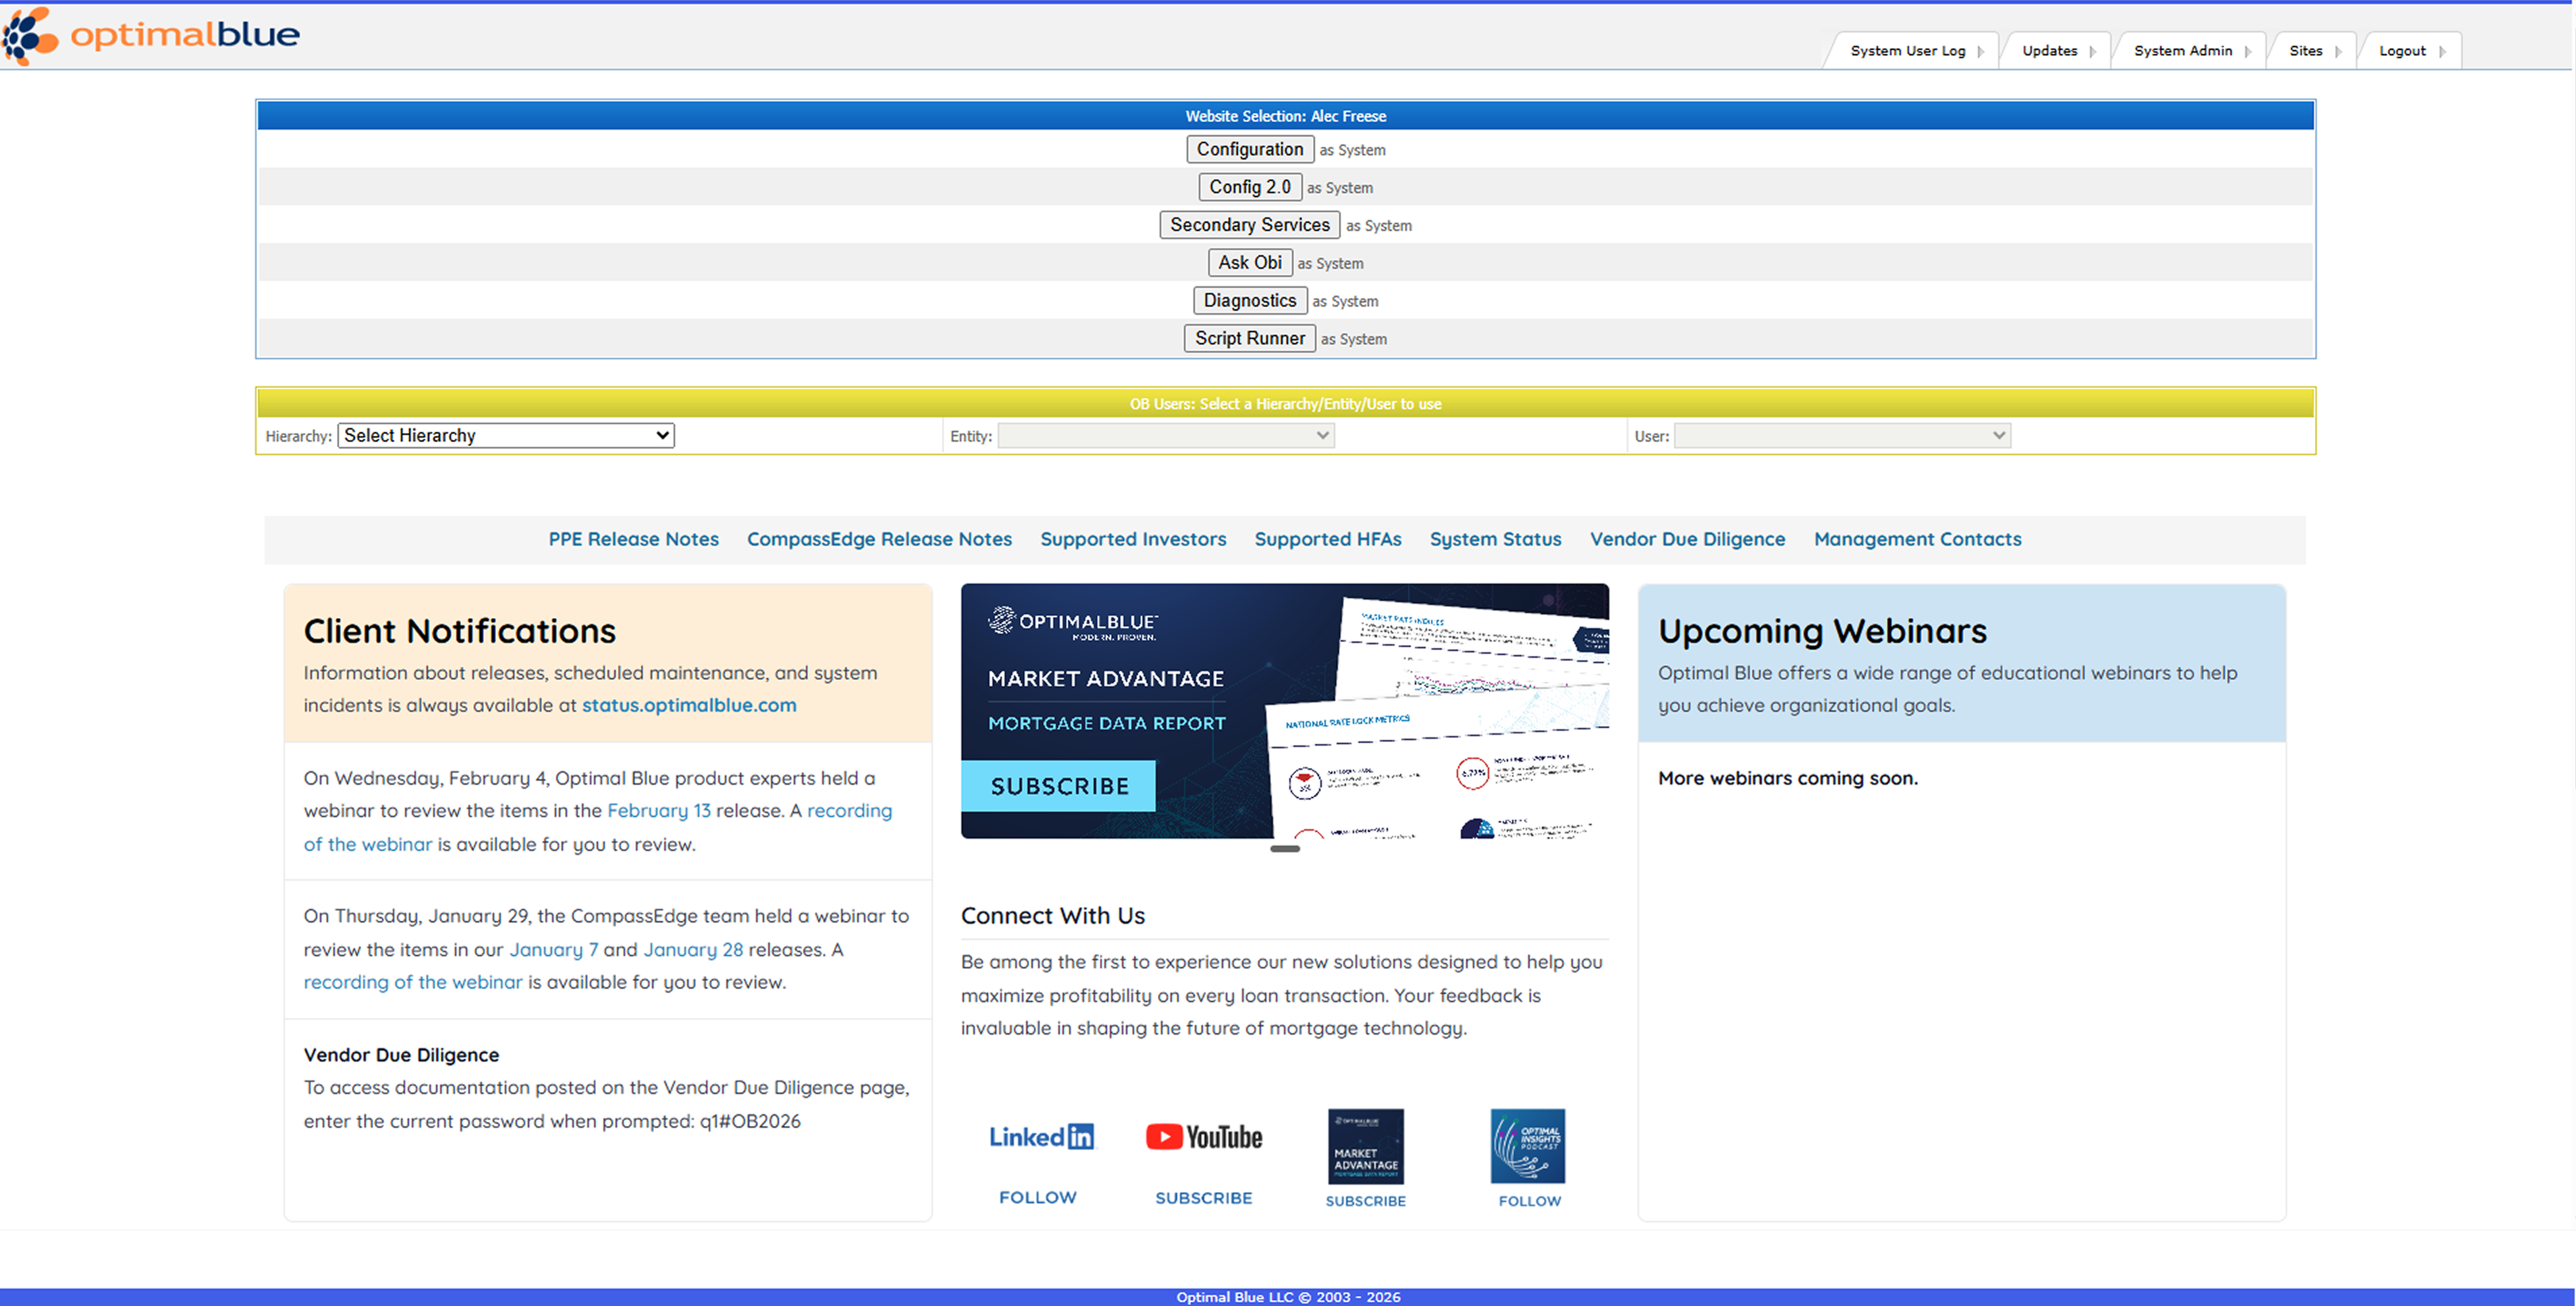
The existing homepage hadn’t evolved with the platform. For a company serving the mortgage industry’s most sophisticated capital markets teams, it was a brand problem and a retention risk rolled into one.
What I Took On
The directive came from the CEO and CPO. Leadership set the strategic direction. The specifics needed someone to own them day-to-day.
So I took on design, scoping, and project management, working directly with the CPO and Product VPs. Given leadership’s bandwidth, I structured the work to maximize the value of each touchpoint.
That started with 14 interviews with product managers across the organization. The goal was to identify which systems, metrics, and tools scattered across Optimal Blue’s products would be most valuable in a single consolidated view. Hedging data next to pricing data next to benchmarking data. From those interviews, 38 potential widget concepts surfaced. Narrowing that to the right 7 widgets (with 11 sub-widgets across tabs) was the first real scoping decision of the project.
I came to leadership with structured recommendations: three options, a recommendation, a rationale. Their input sharpened the final direction, and we moved.
“What impressed me was the scoping. He interviewed the whole PM org, cut thirty-eight ideas down to seven, and came to leadership with a recommendation, not a question.”
Decisions That Shaped It
38 ideas down to 7 widgets
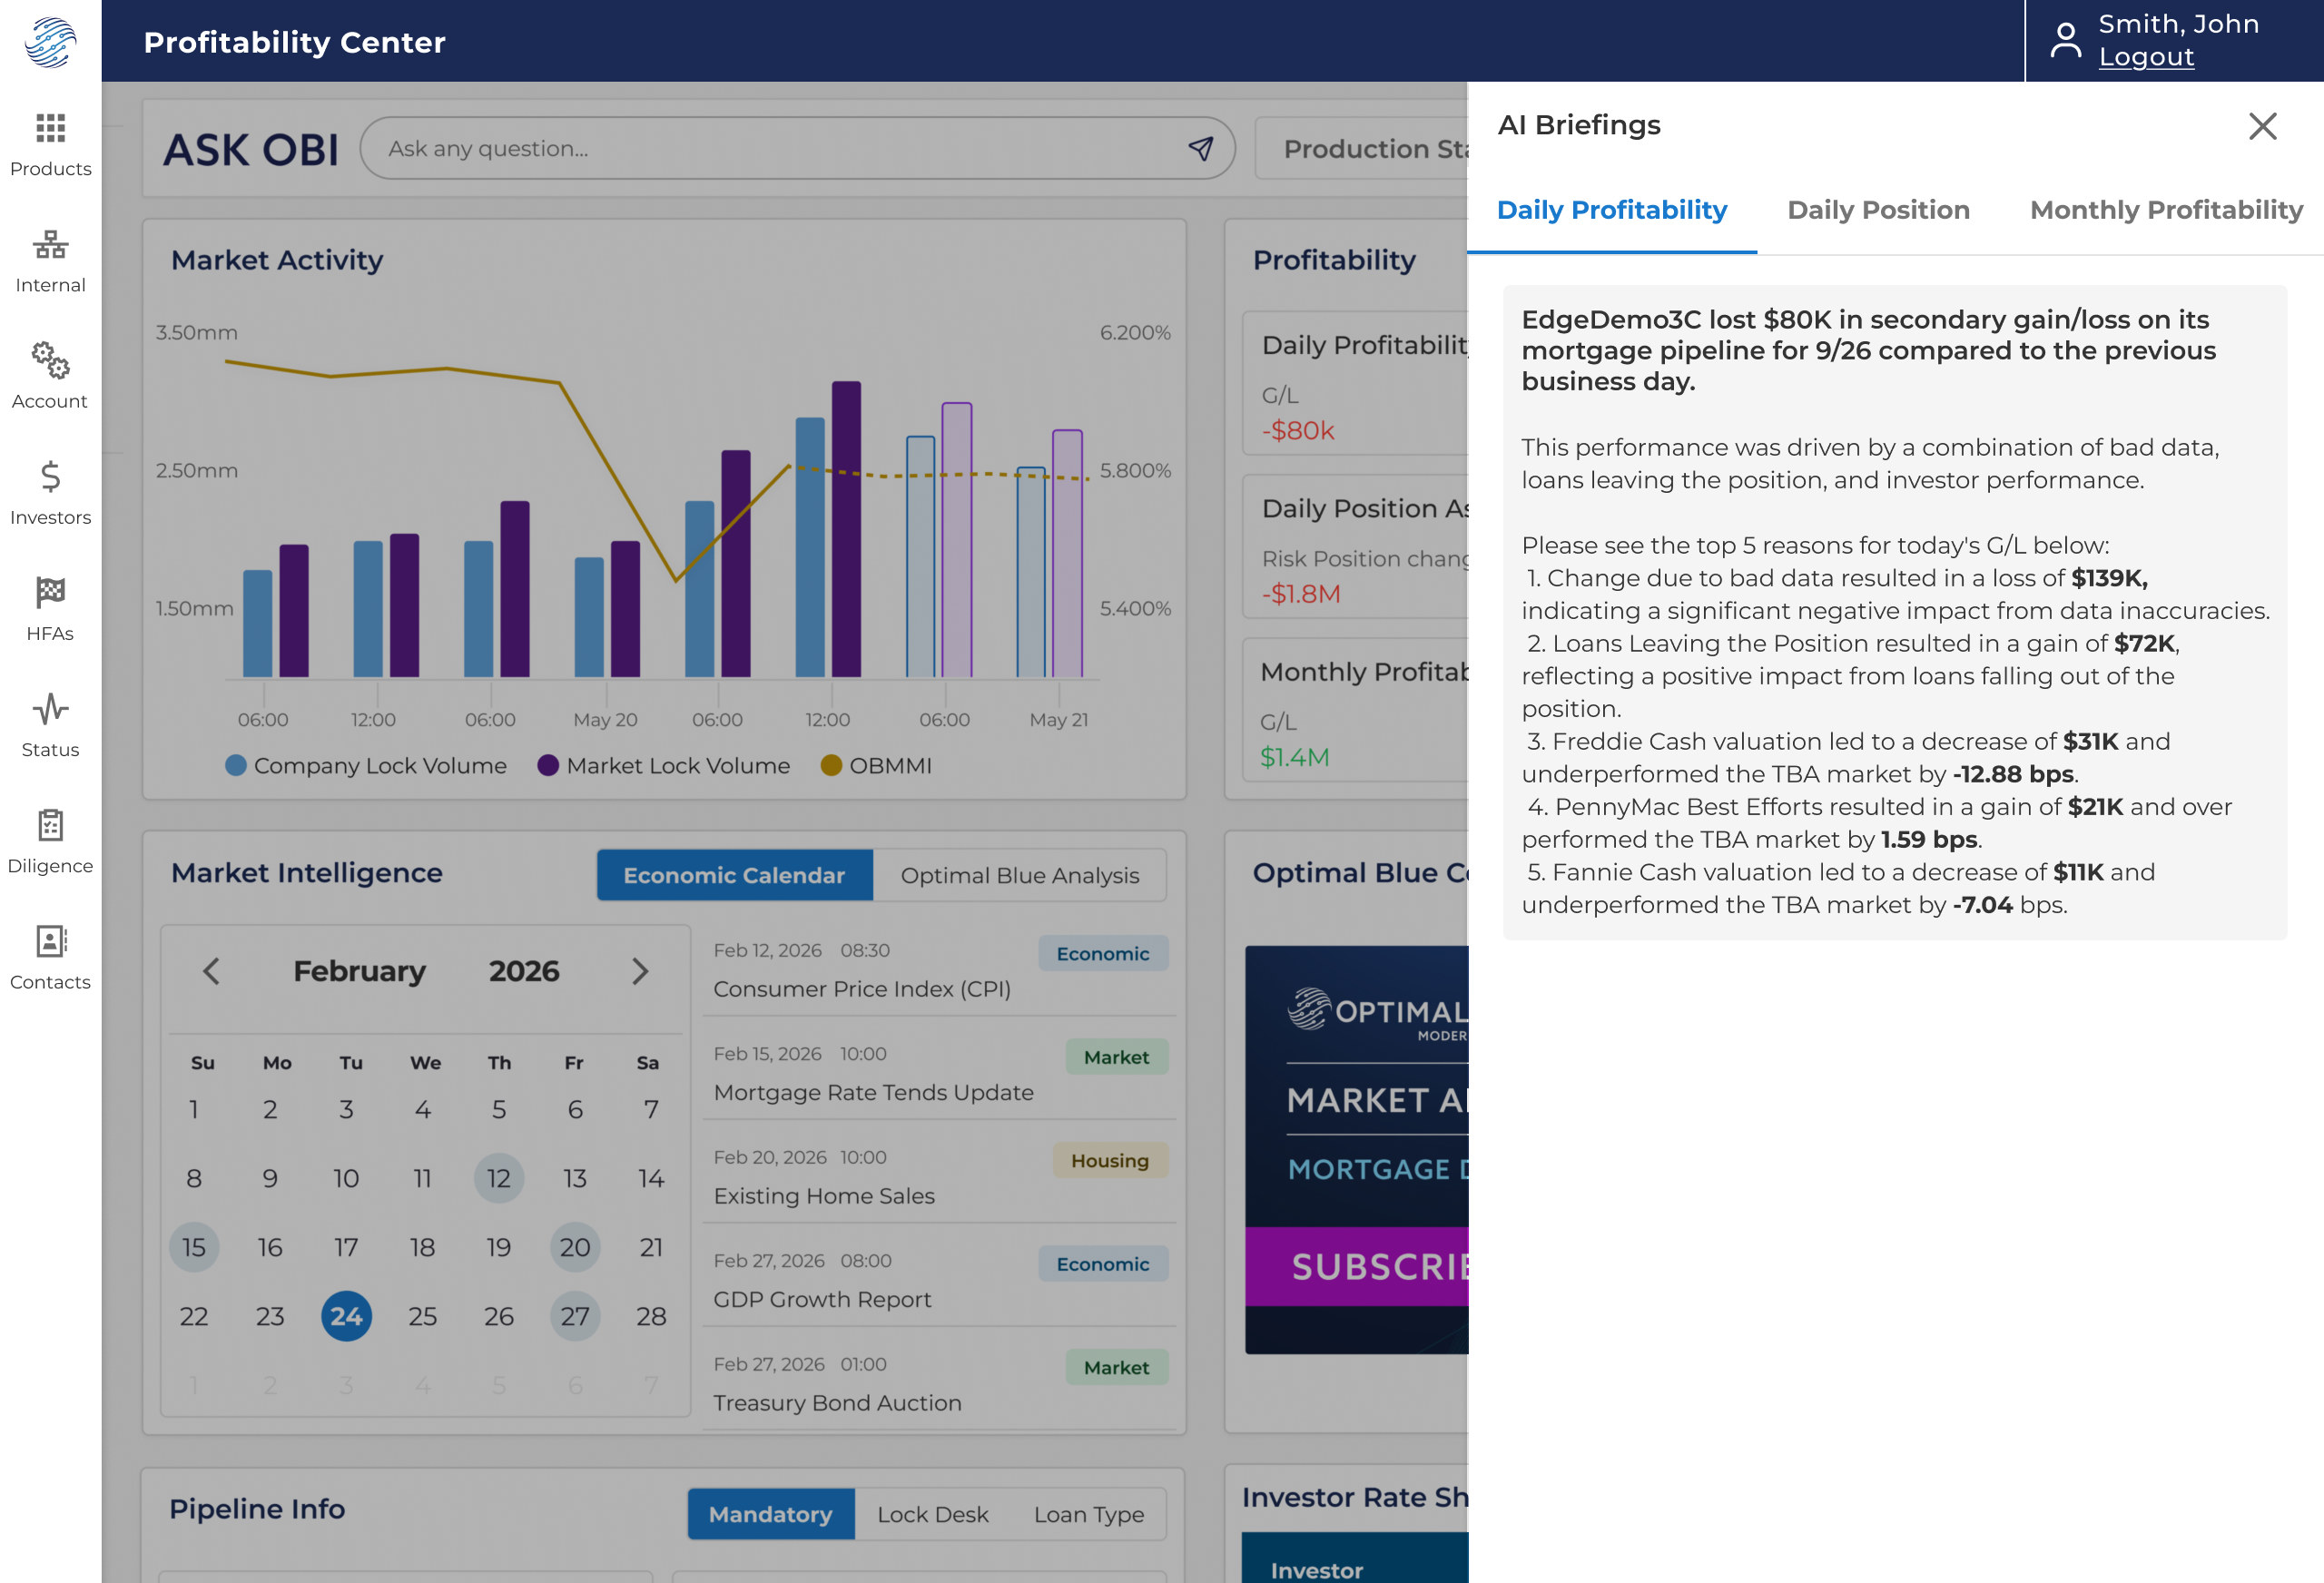
The PM interviews produced far more good ideas than a first release could support. Pricing analytics, hedging performance, benchmarking comparisons, market activity, economic indicators, AI-generated insights, content from OB Central. Each had a reasonable case. The discipline was in what to cut.
The filter: which widgets create immediate, visible value the moment a customer logs in? Not which are most technically impressive or most requested by a single team. The dashboard needed to tell a cohesive story about profitability across the ecosystem, not serve as a catalog of disconnected metrics from every team. Seven widgets shipped. The other 31 stayed on the backlog with clear criteria for when they’d earn a spot.
Daily news briefing became the economic calendar
Early on, there was real momentum behind a “five things to start your day” concept for the Market Intelligence tab. Curated news articles from industry publications, designed to make the dashboard a habitual morning touchpoint. The engagement logic was sound.
Product pushed back. Sourcing and approving content daily created an operational burden with no clear owner. Worse, selecting specific publications introduced bias risk. Whose reporting gets featured? Whose doesn’t? For a platform serving the entire mortgage industry, that was a liability. It was the right call.
The economic calendar, which came out of that feedback, solved the same problem differently. Important industry events, rate decisions, data releases. All presented as unbiased, factual information. Same daily relevance, none of the editorial risk.
Read-only widgets for phase one
There was pressure to make the dashboard interactive from day one. Let users drill into data, take actions, configure views. All reasonable v2 features. For the MVP, the decision was to surface data we already had and present it clearly rather than build new interaction models that would triple scope and delay launch.
The dashboard needed to prove its value through clarity, not complexity. Ship the consolidated view first. Validate that customers actually engage with it. Then layer in interactivity.
From Proof of Concept to Production
Before committing engineering resources, we ran a second round of validation research with some of our largest accounts. The feedback was overwhelmingly positive. It affirmed the general direction and provided granular refinements on data types, time frames, and widget-level details that tightened the final spec.
Once senior leadership approved the direction, the project shifted gears. I began working directly with the PMs and engineers who would own building and shipping it, aligning on scope, addressing technical blockers as they arose, and supporting the team through build and launch.
What Comes Next
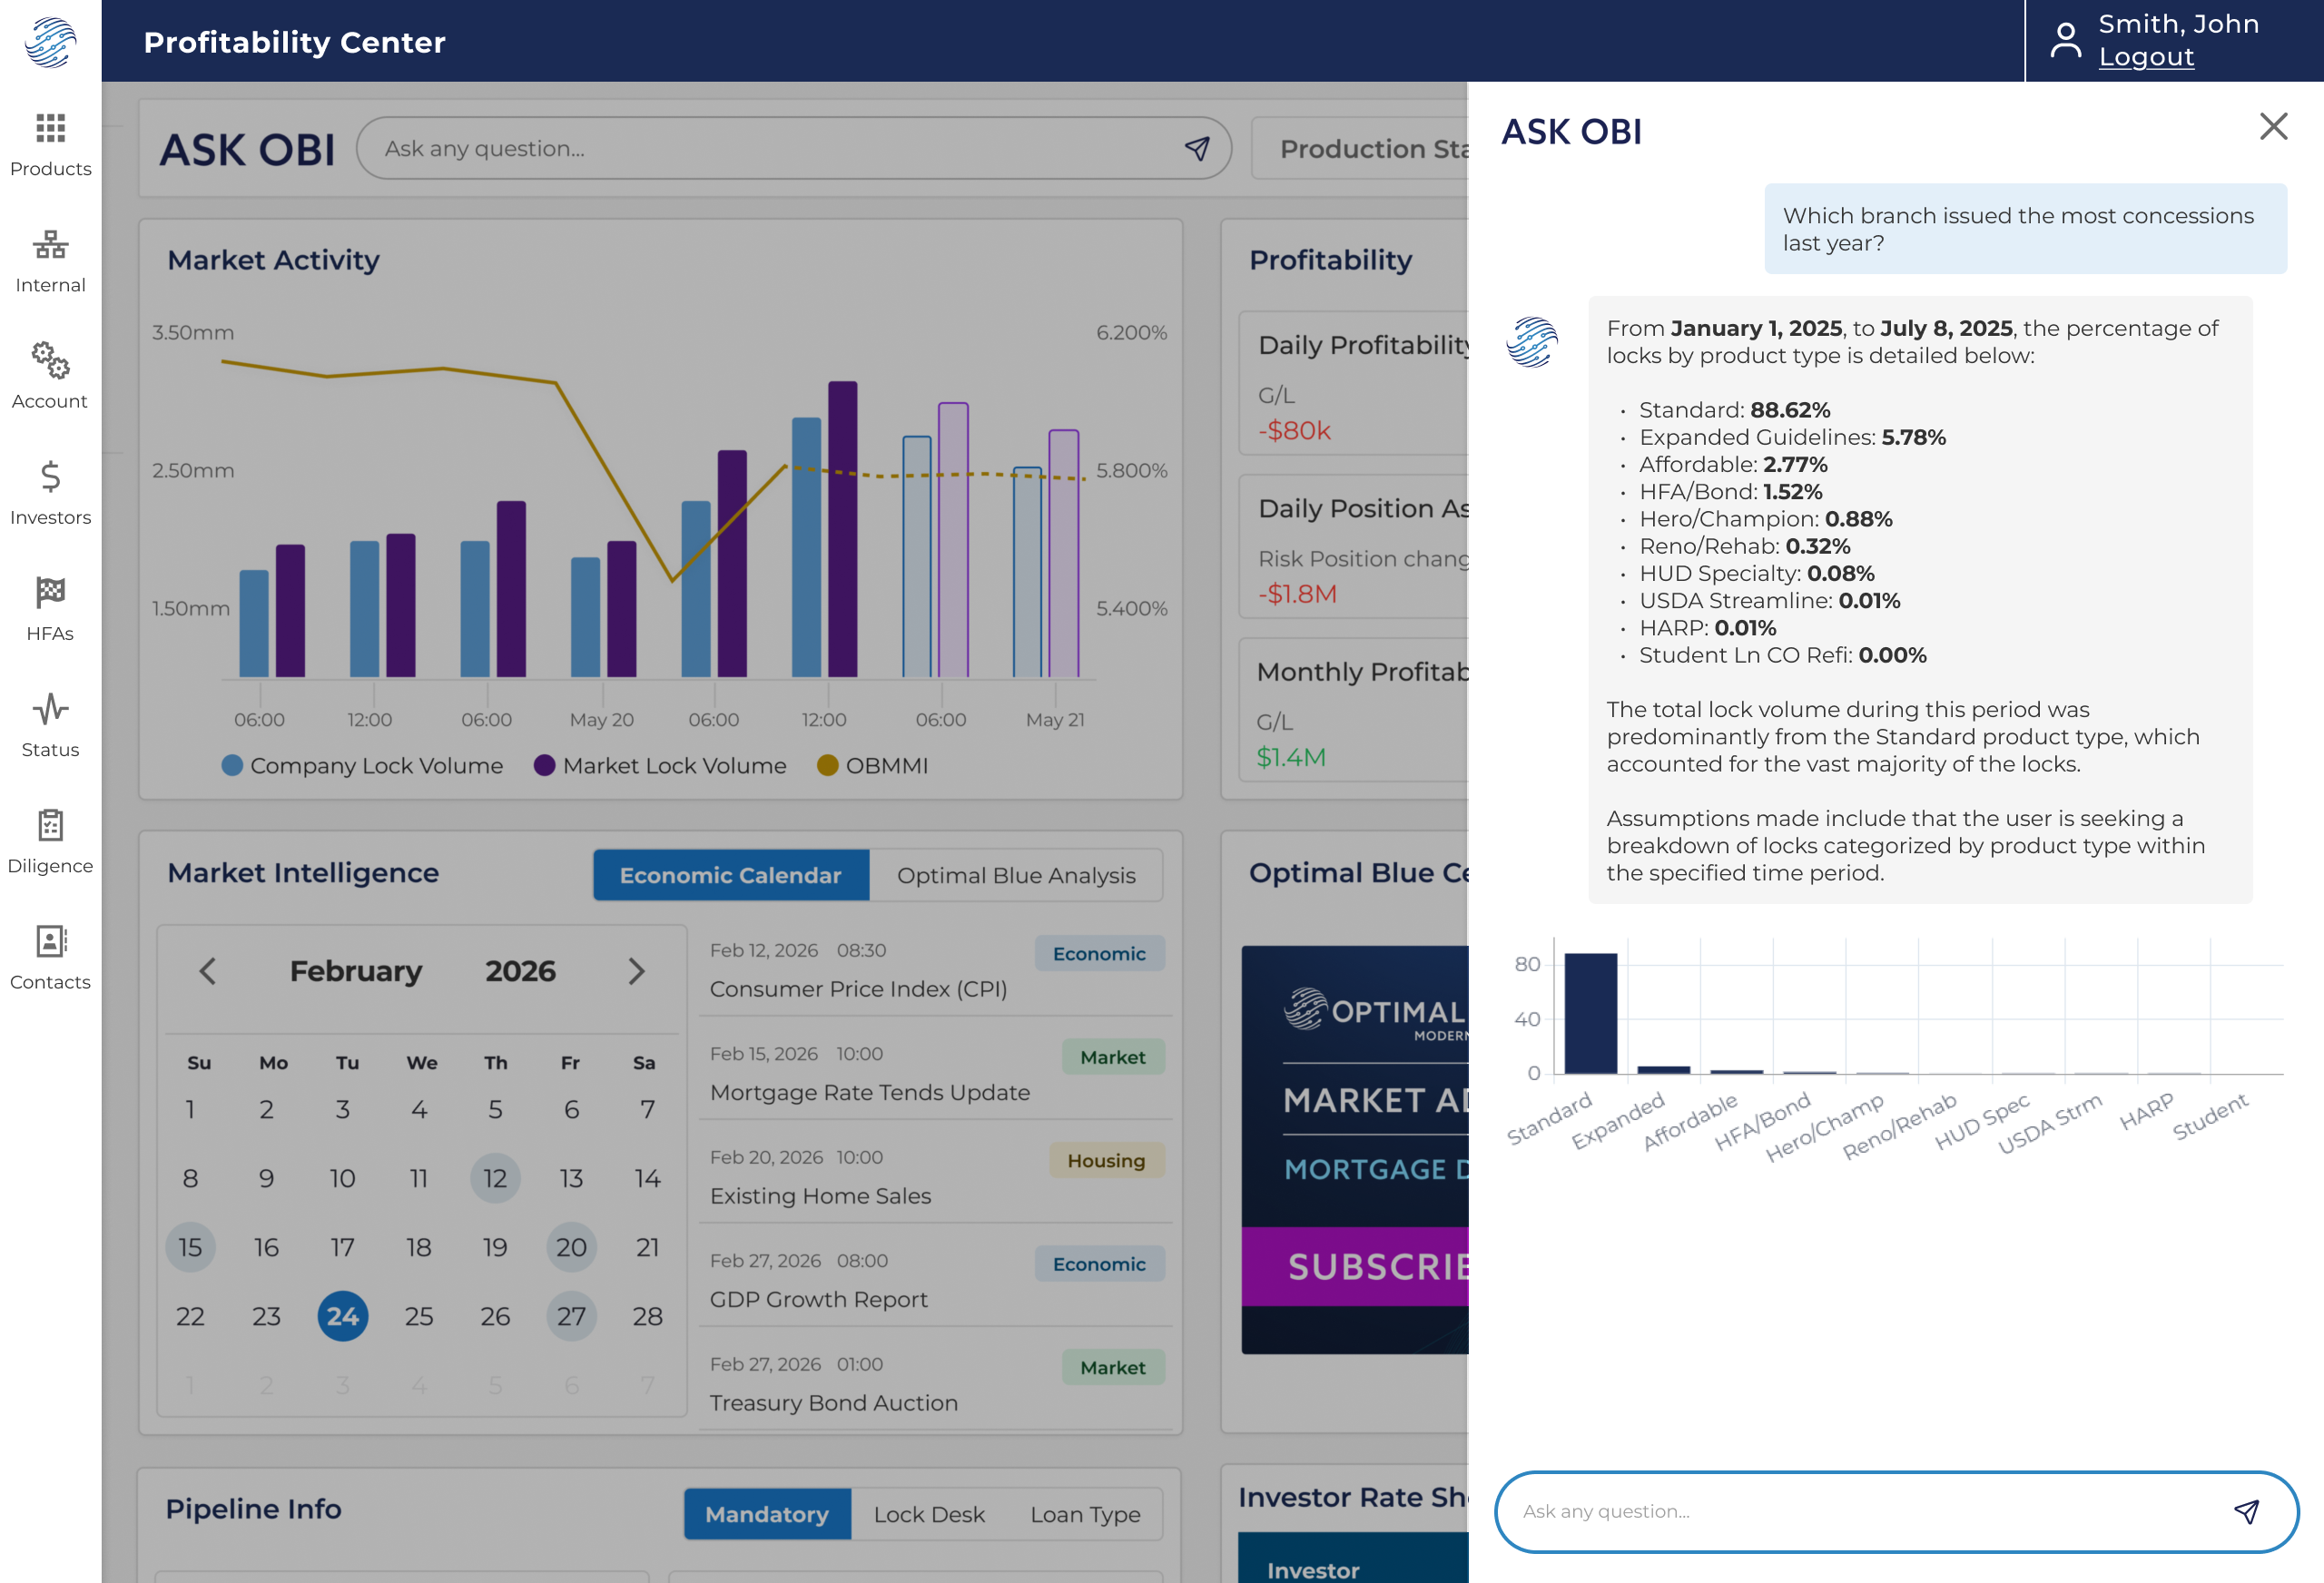
The Profitability Center isn’t a dashboard. It’s a new front door. The first step in shifting Optimal Blue’s product narrative from “we have many tools” to “we have one platform.”
The next phase deepens that. Ask Obi will be embedded directly into individual widgets, letting users discuss specific data in context rather than switching to a separate panel. Drill-downs, configurable views, and action triggers follow as adoption data validates which widgets earn that investment.